On April 24th Deep Learning for Sciences, Engineering, and Arts Meetup, the following problem was discussed: “Why for binary classification don’t we just pick up some values to represent the two possible outcomes (e.g. 0 and 1) and use regression with a linear output and a MSE loss?”. I had the impression that the provided answers were not totally clear for everybody. I am therefore writing this short note, hoping that the arguments presented below will help for a better understanding.
First, let’s remind some definitions.
Regression and Classification
We use the term Regression when our goal is to predict a quantity. For example, predicting house prices from past sells data or predicting the left ventricle volume from cardiac MRI images are two regression problems.
We use the term Classification when our goal is to predict whether a sample belongs to a group. In that case, we typically predict probabilities. For example, deciding if the animal on a picture is a cat or a dog is a classification problem. The decision can be made from the probability that the animal is a dog or not. More specifically, this problem is a binary classification problem since our predictions are divided in two groups, cats or dogs.
Mean Squared Error and Binary Crossentropy
Mean squared error (abbreviated MSE) is commonly used for regression. If \(Y\) and \(\hat{Y}\) represent respectively a vector of true targets, of length \(n\), and their associated predictions, the mean squared error is defined as: \[ MSE\left(Y, \hat{Y}\right) = \frac{1}{n} \sum_{i = 1}^{n} \left(Y_i - \hat{Y}_i\right)^2.\] Note that because of the square, MSE gives a stronger importance to reducing the biggest errors.
Binary crossentropy (also referred as logloss) is usually used in binary classification. It is defined as: \[ Logloss\left(Y, \hat{Y}\right) = -\frac{1}{n} \sum_{i = 1}^{n} Y_i \log(\hat{Y}_i) + \left(1 - Y_i\right) \log(1 - \hat{Y}_i)\] where \(Y_i\) is a label indicating whether a sample belongs to a group and \(\hat{Y}_i\) is the predicted probability to belong to this group.
Back to the question
Suppose that we want to classify cats and dogs. Let’s consider that 0 represents cats and 1 dogs. If we are doing regression with a linear output, we can get values in the range \(]-\infty, +\infty[\). If we want to decide from the output if it is a cat or a dog on the picture, we will probably choose to use a threshold at 0.5 and consider that all values above 0.5 represent a dog and all values below 0.5 a cat. So 2 would represent a dog. And 0 a cat.
Now let’s take a sample with a dog, and look at what happens to the squared error when the output value is 2 or 0: \((2 - 1)^2 = 1 = (0 - 1)^2\). We see that in both cases the squared error is 1, while one value would lead to the correct decision but the other one to the wrong decision. For a better training, the loss function should penalize more outputs that lead to a wrong prediction.
Ok, now let’s change a bit our model and rather than taking a linear output, let’s apply a sigmoid. Below is the plot of a sigmoid:
%matplotlib inline
import matplotlib.pyplot as plt
import numpy as np
x = np.linspace(-10, 10, 100)
sigmoid = lambda x: 1 / (1 + np.exp(-x))
plt.figure(figsize=(12, 6))
plt.plot(x, sigmoid(x))
plt.show()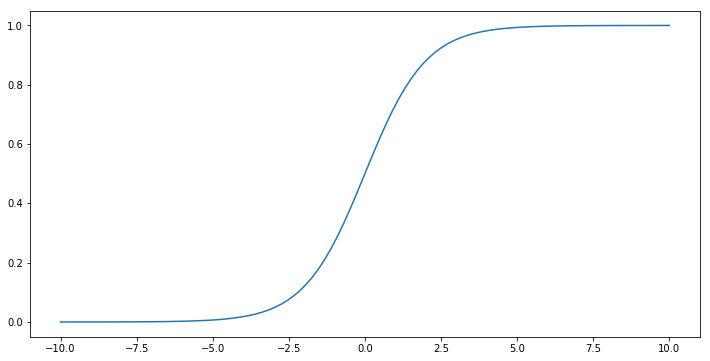
Now the output values of our model are between 0 and 1. The maximum possible squared error is 1, and it always means that we are taking the wrong choice. This looks better already.
Since our output takes values between 0 and 1, we can consider that it represents a probability, the probability of the image being one of a dog. Let’s suppose we have 500 images of dogs and 500 images of cats. If the first image is one of a dog and has a (wrong) prediction value of 0, and all the remaining images have correct predictions with perfect values of 0 or 1 (and therefore a squared error of 0), the MSE will be equal to: \[\frac{1}{1000} \sum_{i = 1}^{1000} \left(Y_i - \hat{Y}_i\right)^2 = \frac{1}{1000} \left(1 + \sum_{i = 2}^{1000} \left(Y_i - \hat{Y}_i\right)^2 \right) = 0.001.\]
Now let’s consider that all predictions are correct, but with probabilities of 0.032 for cats and 0.968 for dogs. This would give a MSE of: \[ \frac{1}{1000} \left(500 \times 0.032^2 + 500 \times (1-0.968)^2\right) = 0.001.\] We see that we get the same error than previously. However, we would prefer to get this result where all predictions are correct rather than the previous one. Overall, when a prediction is not correct, we would prefer that its probability is not too far from 0.5. Logloss penalizes way more strongly any error since its value can go up to infinity! Using logloss will therefore prevent probabilities that are too confident, and terribly wrong.